| (C$ millions, except per share, number and percentage amounts) | Change 2002/2001 | 2002 | 2001 | 2000 | 1999 | 1998 | |||||||||||||||||||||
| Earnings | |||||||||||||||||||||||||||
| Net interest income (2) | 10% | $ | 7,191 | $ | 6,529 | $ | 5,307 | $ | 5,152 | $ | 5,101 | ||||||||||||||||
| Non-interest revenue | 5bp | 8,579 | 8,155 | 6,680 | 5,491 | 4,997 | |||||||||||||||||||||
| Gross revenues (2) | 7bp | 15,770 | 14,684 | 11,987 | 10,643 | 10,098 | |||||||||||||||||||||
| Provision for credit losses | (5)bp | 1,065 | 1,119 | 691 | 760 | 575 | |||||||||||||||||||||
| Non-interest expense | 6bp | 10,244 | 9,641 | 7,628 | 7,141 | 6,510 | |||||||||||||||||||||
| Net income | 19bp | 2,898 | 2,435 | 2,208 | 1,725 | 1,772 | |||||||||||||||||||||
| Core net income (3) | 30bp | 2,898 | 2,231 | 2,208 | 1,813 | 1,789 | |||||||||||||||||||||
| Return on common equity (ROE) | – bp | 16.6% | 16.6% | 19.3% | 15.3% | 17.6% | |||||||||||||||||||||
| Core ROE (3) | 150bp | 16.6% | 15.1% | 19.3% | 16.1% | 17.8% | |||||||||||||||||||||
| Economic Profit (4) | 44% | $ | 838 | $ | 583 | $ | 714 | $ | 337 | $ | 461 | ||||||||||||||||
| Balance sheet data | |||||||||||||||||||||||||||
| Loans (before allowance for loan losses) | –% | $ | 171,523 | $ | 171,177 | $ | 156,184 | $ | 144,793 | $ | 146,772 | ||||||||||||||||
| Assets | 5% | 381,932 | 362,483 | 294,054 | 273,298 | 281,074 | |||||||||||||||||||||
| Deposits | 4% | 245,040 | 235,687 | 206,237 | 187,897 | 180,005 | |||||||||||||||||||||
| Subordinated debentures | 1% | 6,960 | 6,861 | 5,825 | 4,596 | 4,087 | |||||||||||||||||||||
| Common equity | 6% | 17,240 | 16,215 | 11,296 | 10,435 | 9,748 | |||||||||||||||||||||
| Capital ratios (Canadian basis) (5) | |||||||||||||||||||||||||||
| Common equity to risk-adjusted assets | 100bp | 10.4% | 9.4% | 7.3% | 7.1% | 6.2% | |||||||||||||||||||||
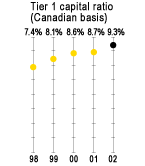
| Tier 1 capital | 60bp | 9.3% | 8.7% | 8.6% | 8.1% | 7.4% | |||||||||||||||||||||
| Total capital | 90bp | 12.7% | 11.8% | 12.0% | 11.2% | 10.5% | |||||||||||||||||||||
| Capital ratios (U.S. basis) (6) | |||||||||||||||||||||||||||
| Common equity to risk-adjusted assets | 100bp | 10.5% | 9.5% | 7.2% | 7.0% | 6.1% | |||||||||||||||||||||
| Tier 1 capital | 40bp | 8.5% | 8.1% | 7.8% | 7.6% | 6.8% | |||||||||||||||||||||
| Total capital | 70bp | 11.9% | 11.2% | 11.3% | 10.7% | 10.1% | |||||||||||||||||||||
| Common share information | |||||||||||||||||||||||||||
| Shares outstanding (in thousands) | |||||||||||||||||||||||||||
| End of year | (1)% | 665,257 | 674,021 | 602,398 | 617,768 | 617,581 | |||||||||||||||||||||
| Average basic | 5% | 672,571 | 641,516 | 606,389 | 626,158 | 617,324 | |||||||||||||||||||||
| Average diluted | 5% | 679,153 | 647,216 | 609,865 | 632,305 | 633,626 | |||||||||||||||||||||
| Earnings per share | |||||||||||||||||||||||||||
| Basic | 16% | $ | 4.16 | $ | 3.58 | $ | 3.42 | $ | 2.50 | $ | 2.64 | ||||||||||||||||
| Diluted | 16% | 4.12 | 3.55 | 3.40 | 2.48 | 2.58 | |||||||||||||||||||||
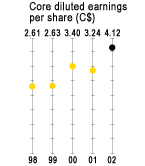
| Core diluted (3) | 27% | 4.12 | 3.24 | 3.40 | 2.63 | 2.61 | |||||||||||||||||||||
| Share price | |||||||||||||||||||||||||||
| High (7) | 11% | 58.89 | 53.25 | 48.88 | 42.13 | 46.10 | |||||||||||||||||||||
| Low (7) | 8% | 45.05 | 41.60 | 27.25 | 29.65 | 28.75 | |||||||||||||||||||||
| Close | 16% | 54.41 | 46.80 | 48.30 | 31.73 | 35.55 | |||||||||||||||||||||
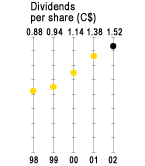
| Dividends per share | 10% | 1.52 | 1.38 | 1.14 | 0.94 | 0.88 | |||||||||||||||||||||
| Book value per share – year-end | 8% | 25.91 | 24.06 | 18.75 | 16.89 | 15.78 | |||||||||||||||||||||
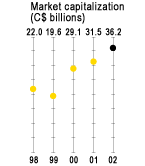
| Market capitalization ($ billions) | 15% | 36.2 | 31.5 | 29.1 | 19.6 | 22.0 | |||||||||||||||||||||
| Number of: | |||||||||||||||||||||||||||
| Employees (full-time equivalent) | 1,981% | 59,549 | 57,568 | 49,232 | 51,891 | 51,776 | |||||||||||||||||||||
| Automated banking machines | (59)% | 4,486 | 4,545 | 4,517 | 4,585 | 4,317 | |||||||||||||||||||||
| Service delivery units | |||||||||||||||||||||||||||
| Canada | (6)% | 1,311 | 1,317 | 1,333 | 1,410 | 1,422 | |||||||||||||||||||||
| International | 83% | 807 | 724 | 306 | 99 | 106 | |||||||||||||||||||||
| |||||||||||||||||||||||||||